Curve Fitting Example
This example demonstrates non-linear curve fitting with visualization steps.
Overview
The pipeline: 1. Generates synthetic data from a known exponential decay function with added Gaussian noise 2. Plots the raw data as a scatter plot 3. Fits an exponential model using scipy's curve_fit 4. Creates a comparison plot showing data points with the fitted curve
Model
The underlying model is exponential decay:
True parameters used for data generation: a=5.0, b=0.3, c=1.0
Pipeline Structure
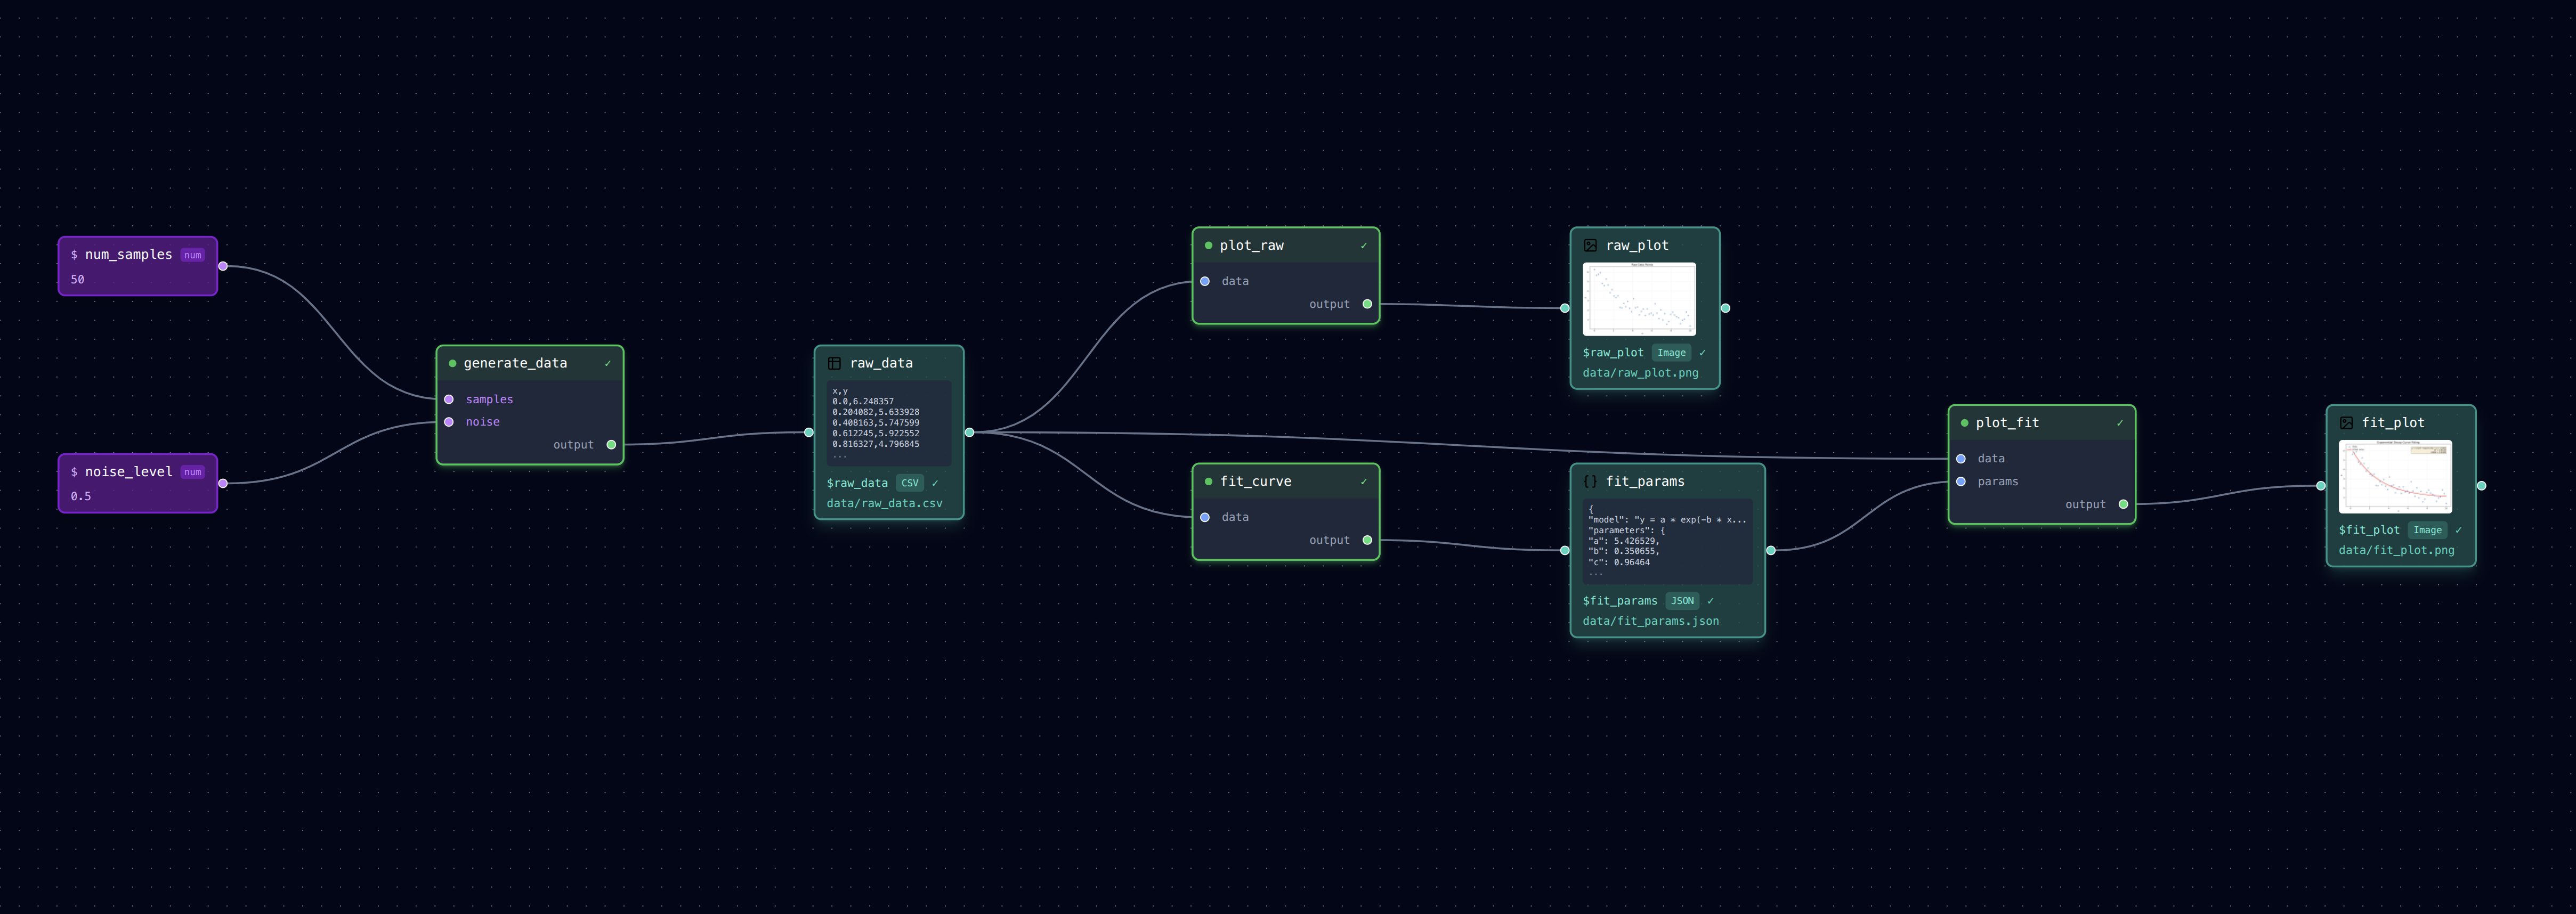
generate_data ──► raw_data.csv ──┬──► plot_raw ──► raw_plot.png
                                 │
                                 ├──► fit_curve ──► fit_params.json
                                 │                        │
                                 └────────────────────────┴──► plot_fit ──► fit_plot.png
Running
# Install example dependencies
pip install loom-pipeline[examples]

# Run the pipeline
loom examples/curve-fitting/pipeline.yml

# Or open in the visual editor
loom-ui examples/curve-fitting/pipeline.yml
Parameters
num_samples: Number of data points (default: 50)noise_level: Standard deviation of Gaussian noise (default: 0.5)
Dependencies
- numpy
- scipy
- matplotlib